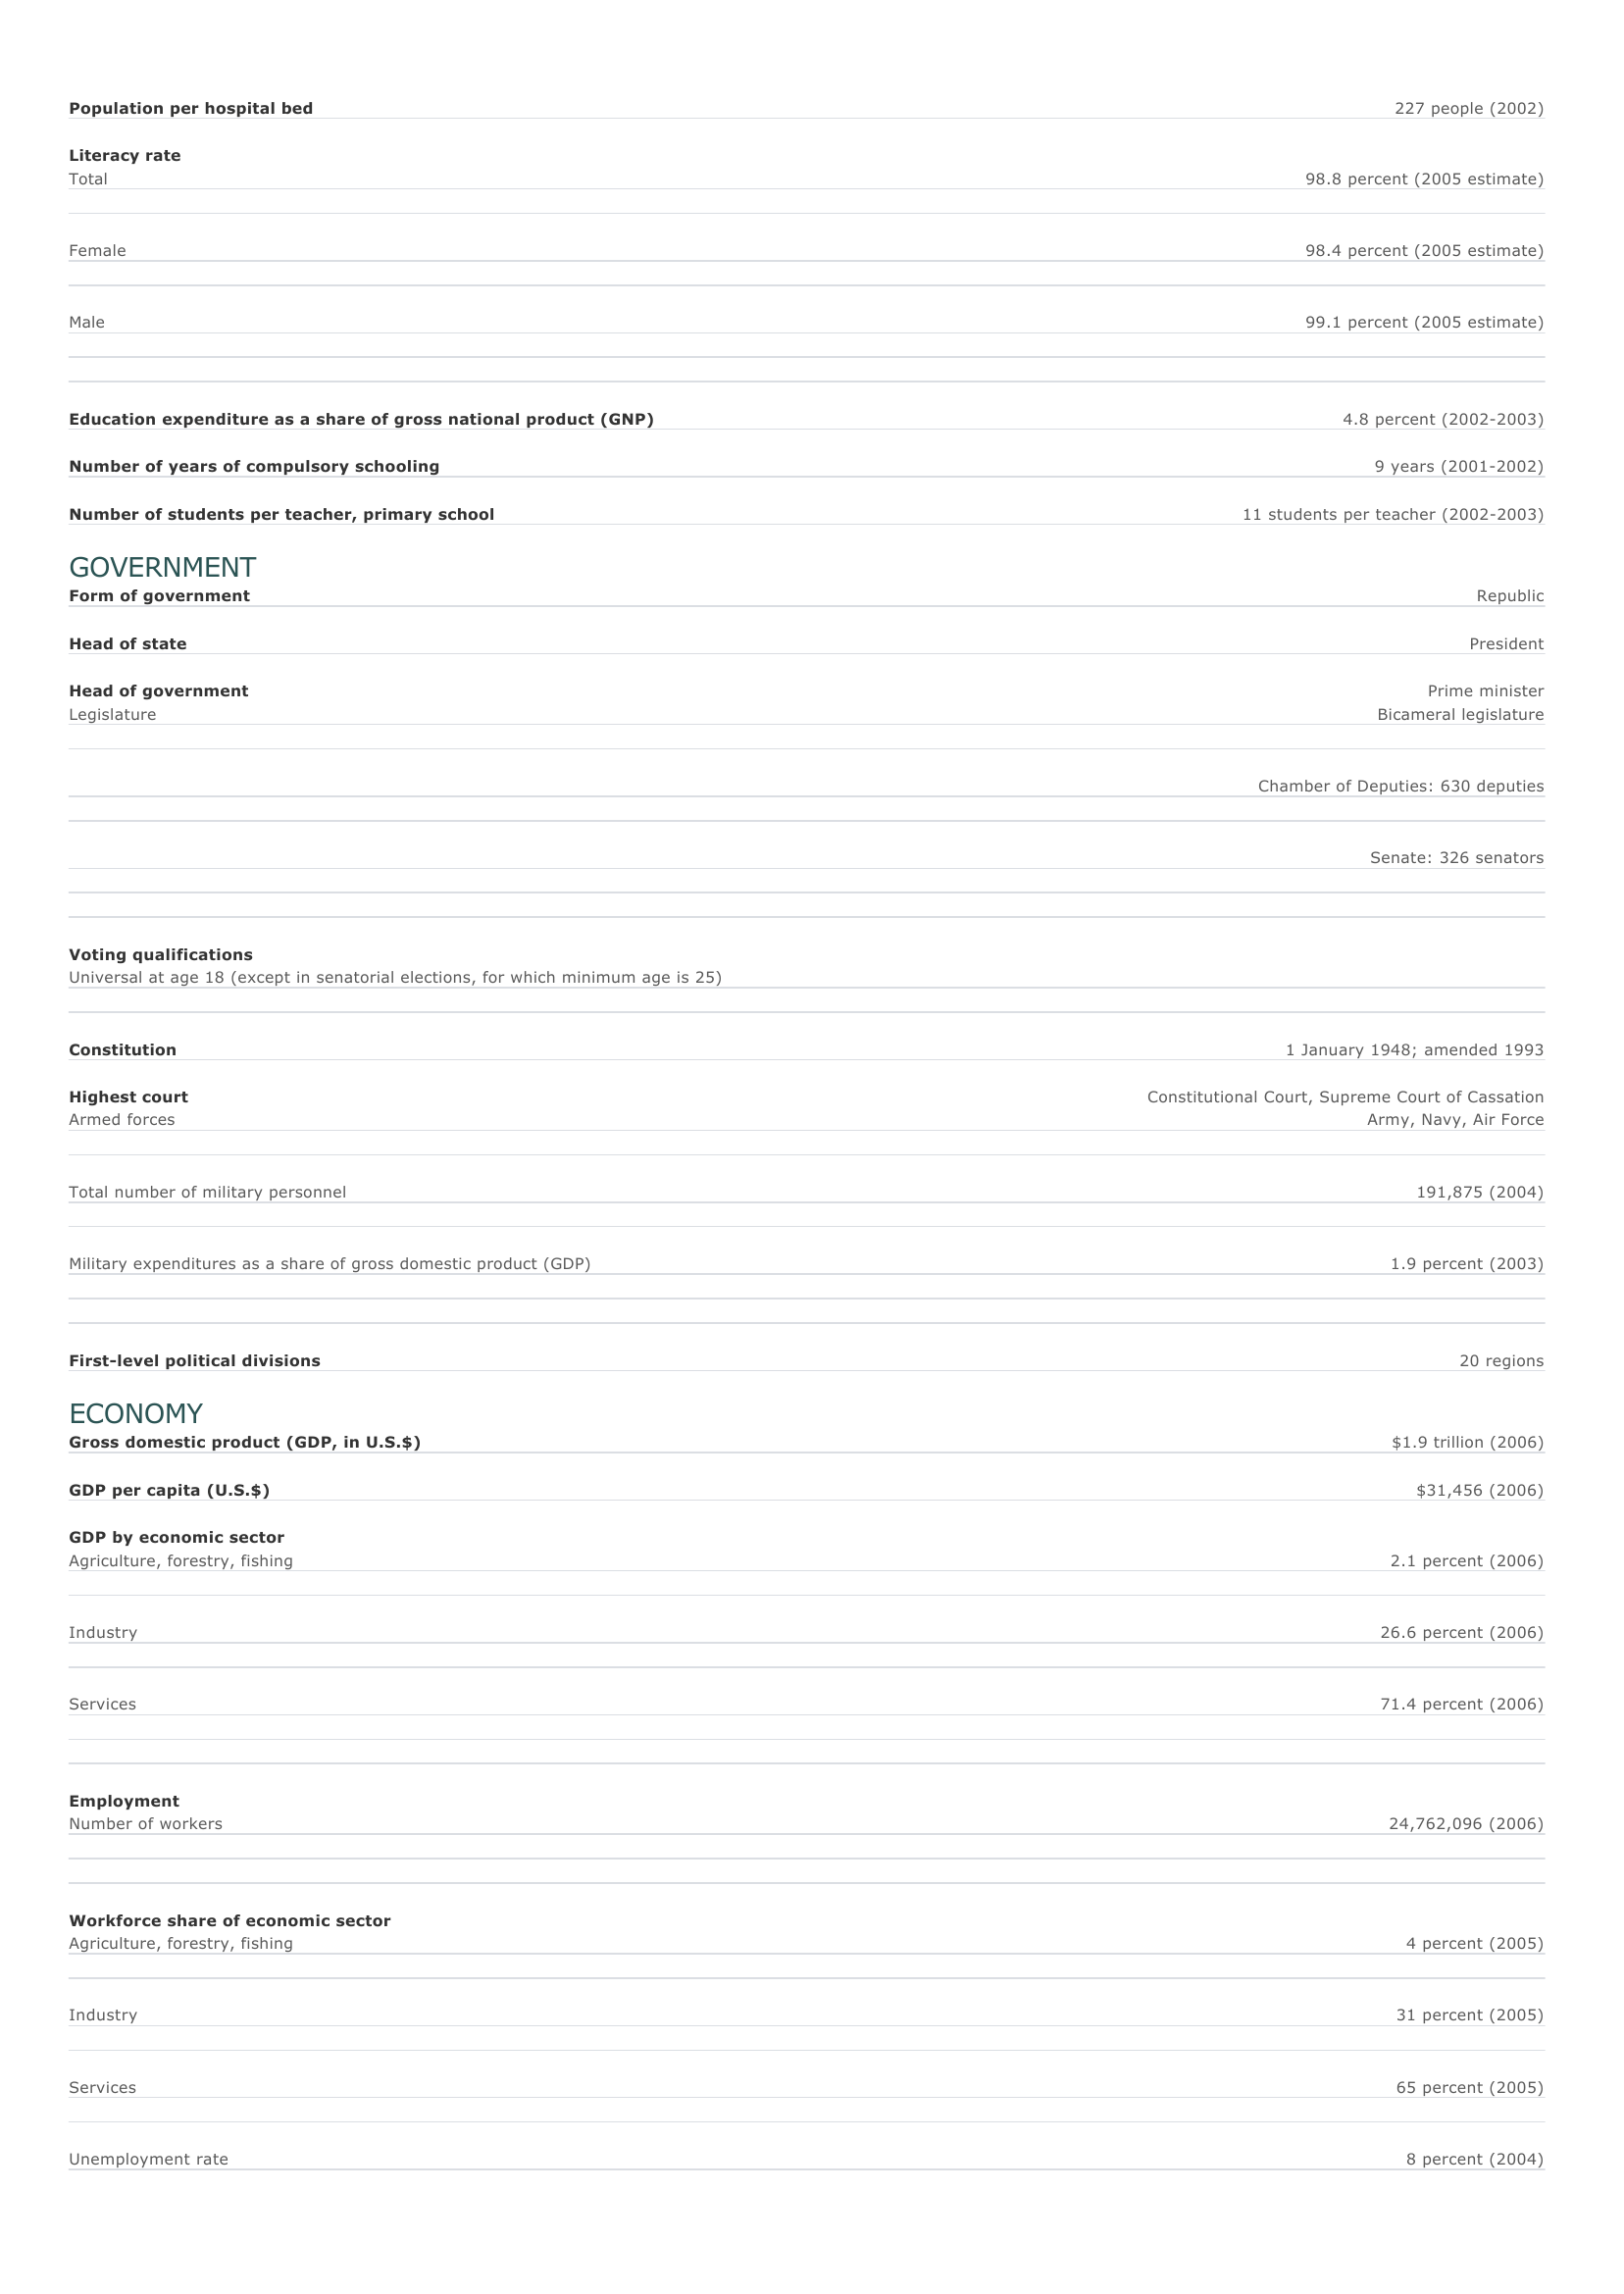
Italy Facts and Figures. BASIC FACTS Official name Italian Republic Capital Rome Area 301,323 sq km 116,341 sq mi PEOPLE Population 58,145,321 (2008 estimate) Population growth Population growth rate -0.02 percent (2008 estimate) Projected population in 2025 56,234,163 (2025 estimate) Projected population in 2050 50,389,841 (2050 estimate) Population density 198 persons per sq km (2008 estimate) 512 persons per sq mi (2008 estimate) Urban/rural distribution Share urban 68 percent (2005 estimate) Share rural 32 percent (2005 estimate) Largest cities, with population R ome 2,705,603 (2007 estimate) Milan 1,303,437 (2007 estimate) Naples 975,139 (2007 estimate) Turin 900,569 (2007 estimate) Palermo 666,552 (2007 estimate) Ethnic groups Italian (includes small clusters of German-, French-, and Slovene-Italians in the north and Albanian- and Greek-Italians in the south), Sicilian, Sardinian Languages Italian (official), German, French, Slovenian, Ladin, regional Italian dialects Religious affiliations Roman Catholic O ther 98 percent 2 percent HEALTH AND EDUCATION Life expectancy Total 80.1 years (2008 estimate) Female 83.2 years (2008 estimate) Male 77.1 years (2008 estimate) Infant mortality rate Population per physician 6 deaths per 1,000 live births (2008 estimate) 270 people (2006) Population per hospital bed 227 people (2002) Literacy rate Total 98.8 percent (2005 estimate) Female 98.4 percent (2005 estimate) Male 99.1 percent (2005 estimate) Education expenditure as a share of gross national product (GNP) Number of years of compulsory schooling Number of students per teacher, primary school 4.8 percent (2002-2003) 9 years (2001-2002) 11 students per teacher (2002-2003) GOVERNMENT Form of government Head of state Head of government Legislature Republic President Prime minister Bicameral legislature Chamber of Deputies: 630 deputies Senate: 326 senators Voting qualifications Universal at age 18 (except in senatorial elections, for which minimum age is 25) Constitution Highest court Armed forces Total number of military personnel Military expenditures as a share of gross domestic product (GDP) First-level political divisions 1 January 1948; amended 1993 Constitutional Court, Supreme Court of Cassation Army, Navy, Air Force 191,875 (2004) 1.9 percent (2003) 20 regions ECONOMY Gross domestic product (GDP, in U.S.$) GDP per capita (U.S.$) GDP by economic sector Agriculture, forestry, fishing $1.9 trillion (2006) $31,456 (2006) 2.1 percent (2006) I ndustry 26.6 percent (2006) Services 71.4 percent (2006) Employment Number of workers Workforce share of economic sector Agriculture, forestry, fishing 24,762,096 (2006) 4 percent (2005) I ndustry 31 percent (2005) Services 65 percent (2005) Unemployment rate 8 percent (2004) National budget (U.S.$) Total revenue $688,525 million (2006) Total expenditure $755,738 million (2006) Monetary unit* 1 euro (EUR), consisting of 100 cents *The Italian lira (Lit) became linked to the EU single currency, the euro (EUR), on 1 January 1999 at a fixed rate of 1936.27 to 1 euro (EUR). Euro coins and bills replaced the Italian lira as the national currency on January 1, 2002. Agriculture Grapes, olives, wheat, tomatoes, maize, sugar beets, apples, peaches, potatoes Mining Petroleum, natural gas, lignite, pyrites, fluorspar, barites, sulfur, mercury Manufacturing Machinery and transportation equipment, textiles and clothing, chemicals Major exports Machinery, motor vehicles, clothing, textile yarn and fabrics, footwear, iron and steel, fruit and vegetables, wine Major imports Machinery and transportation equipment, petroleum, metals, chemicals, textile yarn and fabrics, meat. Major trade partners for exports Germany, France, United States, United Kingdom, and Spain Major trade partners for imports Germany, France, Netherlands, United Kingdom, and United States ENERGY, COMMUNICATIONS, AND TRANSPORTATION Electricity production Electricity from thermal sources 82.35 percent (2003 estimate) Electricity from hydroelectric sources 13.45 percent (2003 estimate) Electricity from nuclear sources Electricity from geothermal, solar, and wind sources 0 percent (2003 estimate) 4.20 percent (2003 estimate) Number of radios per 1,000 people 880 (1997) Number of telephones per 1,000 people 427 (2005) Number of televisions per 1,000 people 499 (2000 estimate) Number of Internet hosts per 10,000 people 114 (2003) Daily newspaper circulation per 1,000 people 104 (1996) Number of motor vehicles per 1,000 people 610 (1999) Paved road as a share of total roads 100 percent (2003) SOURCES Basic Facts and People sections Area data are from the statistical bureaus of individual countries. Population, population growth rate, and population projections are from the United States Census Bureau, International Programs Center, International Data Base (IDB) (www.census.gov). Urban and rural population data are from the Food and Agriculture Organization (FAO) of the United Nations (UN), FAOSTAT database (www.fao.org). Largest cities population data and political divisions data are from the statistical bureaus of individual countries. Ethnic divisions and religion data are largely from the latest Central Intelligence Agency (CIA) World Factbook and from various country censuses and reports. Language data are largely from the Ethnologue, Languages of the World, Summer Institute of Linguistics International (www.sil.org). Health and Education section Life expectancy and infant mortality data are from the United States Census Bureau, International Programs Center, International database (IDB) (www.census.gov). Population per physician and population per hospital bed data are from the World Health Organization (WHO) (www.who.int). Education data are from the United Nations Educational, Scientific and Cultural Organization (UNESCO) database (www.unesco.org). Government section Government, independence, legislature, constitution, highest court, and voting qualifications data are largely from various government Web sites, the latest Europa World Yearbook, and the latest Central Intelligence Agency (CIA) World Factbook. The armed forces data is from Military Balance. Economy section Gross domestic product (GDP), GDP per capita, GDP by economic sectors, employment, and national budget data are from the World Bank database (www.worldbank.org). Monetary unit, agriculture, mining, manufacturing, exports, imports, and major trade partner information is from the statistical bureaus of individual countries, latest Europa World Yearbook, and various United Nations and International Monetary Fund (IMF) publications. Energy, Communication, and Transportation section Electricity information is from the Energy Information Administration (EIA) database (www.eia.doe.gov). Radio, telephone, television, and newspaper information is from the United Nations Educational, Scientific and Cultural Organization (UNESCO) database (www.unesco.org). Internet hosts, motor vehicles, and road data are from the World Bank database (www.worldbank.org). Note Figures may not total 100 percent due to rounding. Microsoft ® Encarta ® 2009. © 1993-2008 Microsoft Corporation. All rights reserved.


