Devoir de Philosophie

Nunavut Territory - Facts and Figures.

Publié le 10/05/2013

Extrait du document

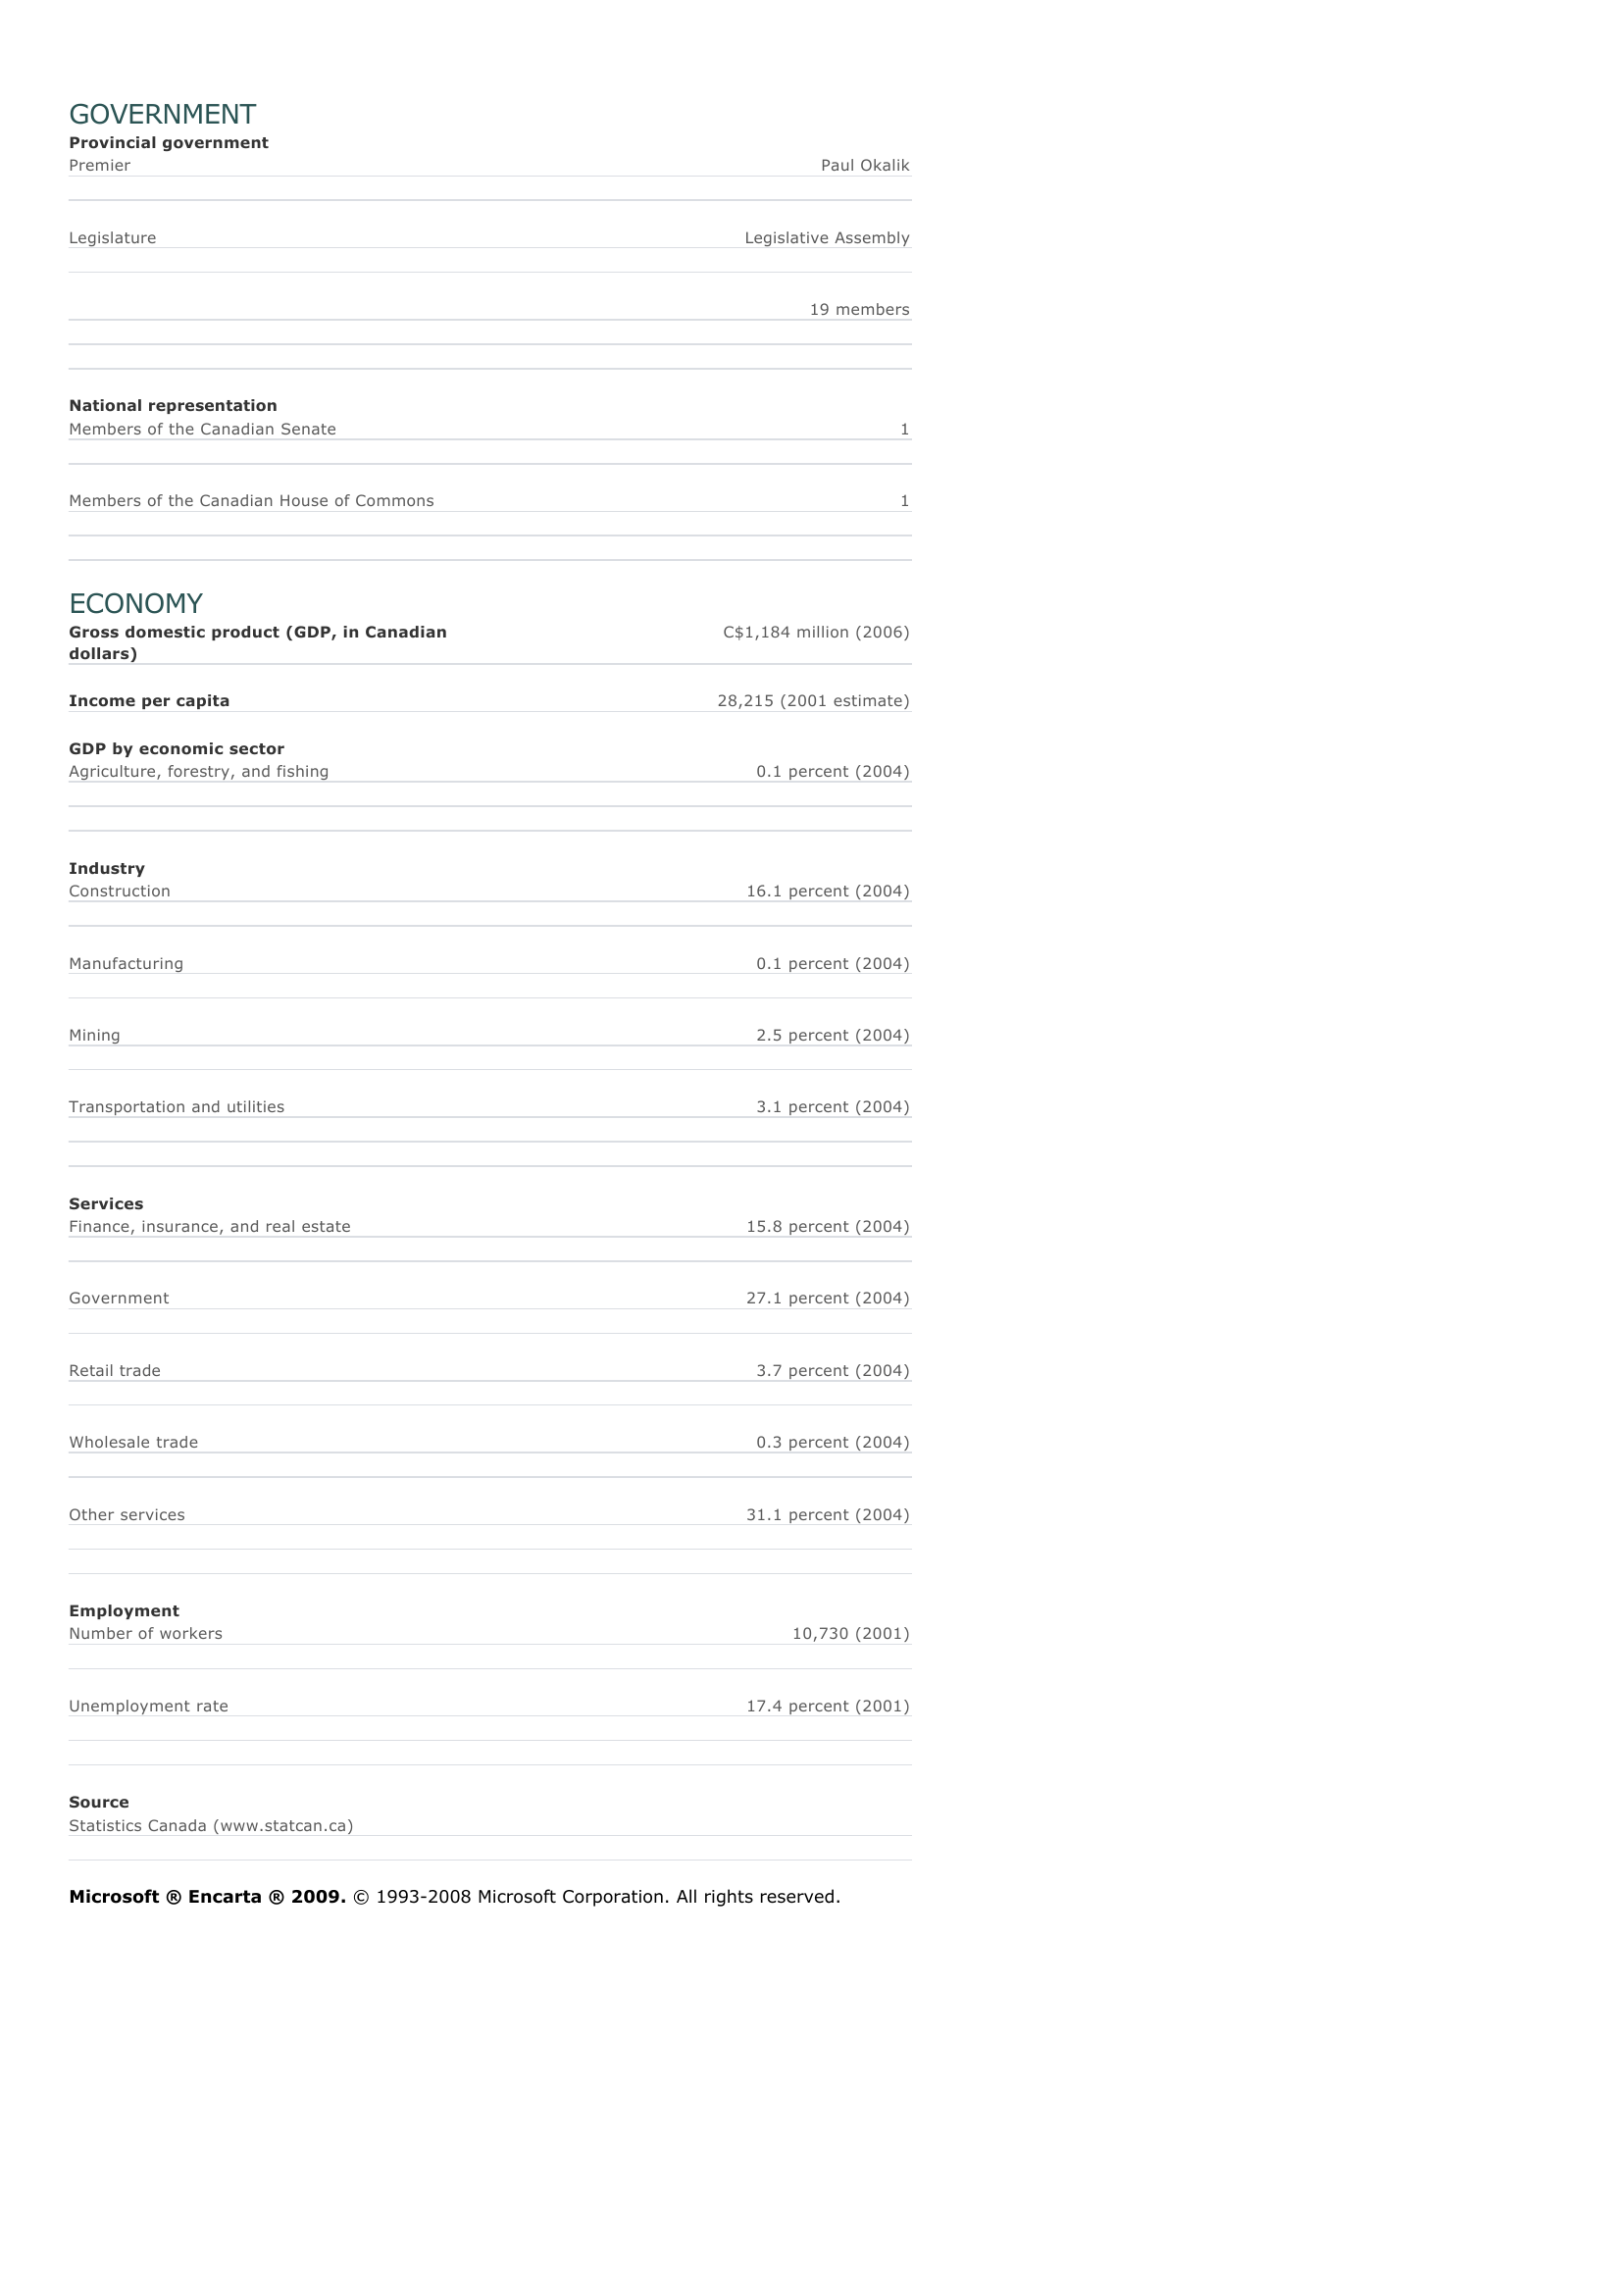
Nunavut Territory - Facts and Figures. GENERAL INFORMATION Capital Entry into federation Abbreviation Iqaluit April 1, 1999 NU LAND Total area Rank among provinces and territories in total area Land area 2,093,190 sq km 808,185 sq mi 1st 1,936,113 sq km 747,537 sq mi Highest point Barbeau Peak 2,616 m/8,583 ft Forested land as a share of land area 0 percent PEOPLE Population Rank among provinces and territories in population Population growth rate Population density 31,100 (2007 estimate) 13th 1.1 percent (2004-2005) 0.016 persons per sq km (2006 estimate) 0.040 persons per sq mi (2006 estimate) Urbanization 33 percent (2001) Largest cities (by population) Iqaluit 6,184 (2006) Rankin Inlet 2,358 (2006) Arviat 2,060 (2006) B aker Lake 1,728 (2006) Pangnirtung 1,325 (2006) Language groups Speakers of English 44.2 percent (2006) Speakers of French 0.7 percent (2006) Speakers of English and French 3.8 percent (2001) Speakers of other languages 13.1 percent (2001) HEALTH AND EDUCATION Life expectancy Infant mortality rate Health-care expenditure per capita Adult population with high school diploma 68.5 years (2003 estimate) 10 deaths per 1,000 live births (2005 estimate) 8,751 Canadian dollars (2004 estimate) 65 percent (2001 estimate) GOVERNMENT Provincial government Premier Legislature Paul Okalik Legislative Assembly 19 members National representation Members of the Canadian Senate 1 Members of the Canadian House of Commons 1 ECONOMY Gross domestic product (GDP, in Canadian dollars) Income per capita GDP by economic sector Agriculture, forestry, and fishing Industry Construction C$1,184 million (2006) 28,215 (2001 estimate) 0.1 percent (2004) 16.1 percent (2004) Manufacturing 0.1 percent (2004) Mining 2.5 percent (2004) Transportation and utilities 3.1 percent (2004) Services Finance, insurance, and real estate 15.8 percent (2004) G overnment 27.1 percent (2004) Retail trade 3.7 percent (2004) Wholesale trade 0.3 percent (2004) Other services Employment Number of workers Unemployment rate 31.1 percent (2004) 10,730 (2001) 17.4 percent (2001) Source Statistics Canada (www.statcan.ca) Microsoft ® Encarta ® 2009. © 1993-2008 Microsoft Corporation. All rights reserved.

« GOVERNMENTProvincial governmentPremier Paul Okalik Legislature Legislative Assembly 19 members National representationMembers of the Canadian Senate 1 Members of the Canadian House of Commons 1 ECONOMYGross domestic product (GDP, in Canadiandollars) C$1,184 million (2006) Income per capita 28,215 (2001 estimate) GDP by economic sectorAgriculture, forestry, and fishing 0.1 percent (2004) IndustryConstruction 16.1 percent (2004) Manufacturing 0.1 percent (2004) Mining 2.5 percent (2004) Transportation and utilities 3.1 percent (2004) ServicesFinance, insurance, and real estate 15.8 percent (2004) Government 27.1 percent (2004) Retail trade 3.7 percent (2004) Wholesale trade 0.3 percent (2004) Other services 31.1 percent (2004) EmploymentNumber of workers 10,730 (2001) Unemployment rate 17.4 percent (2001) SourceStatistics Canada (www.statcan.ca) Microsoft ® Encarta ® 2009. © 1993-2008 Microsoft Corporation.

All rights reserved.. »

↓↓↓ APERÇU DU DOCUMENT ↓↓↓

Liens utiles